The "Australian Energy Council (AEC)" recently released the 2023 annual report. How is the overall situation of the Australian residential PV energy storage market? What market opportunities exist? We will provide an in-depth analysis.
Rooftop PV continues to show strong growth
System average size reaches a historic high
Huge potential for storage batteries, with New South Wales leading
Investment payback period
In 2023, Australia's rooftop PV continued to grow strongly, with an additional 2.78 GW installed, bringing the cumulative installed capacity to 22.07 GW.
Due to delays in system certification, it is expected that once the data is updated, the actual installation for 2023 will reach 2.99 GW, an increase of 7.18% compared to 2022.

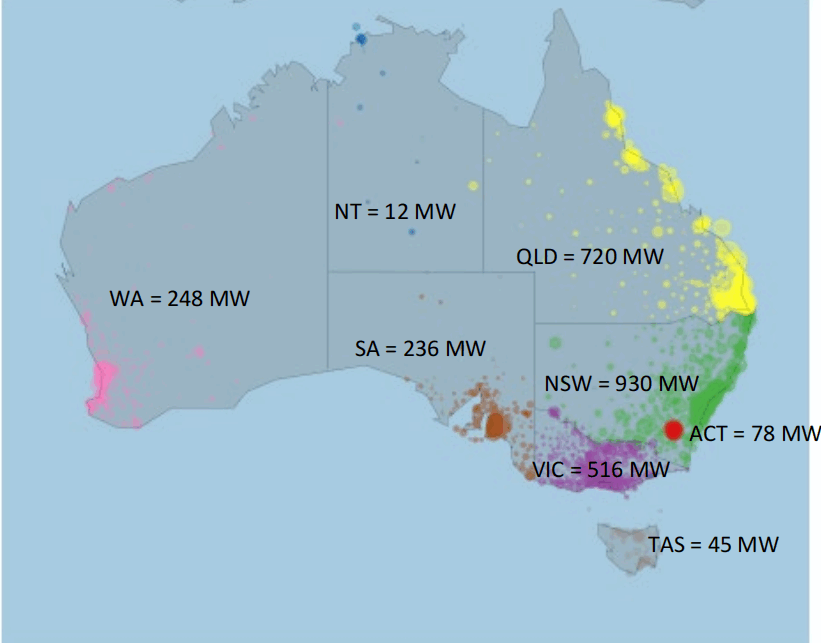
New Installations by State
By state: New South Wales (NSW) leads with 930 MW installed. Queensland (QLD) follows with 720 MW; Victoria (VIC) has 516 MW; Western Australia (WA) 248 MW; South Australia (SA) 236 MW; Tasmania (TAS) 45 MW; Australian Capital Territory (ACT) 78 MW; and Northern Territory (NT) the least with 12 MW.
By the end of 2023, a total of 3,691,626 households and businesses in Australia had installed solar PV. Queensland has the most, with over 1 million (1,003,543) systems. New South Wales follows with 947,357 systems, and Victoria is third with 724,554 systems, making up 72% of the national total. The Northern Territory has the least, with only 22,744 systems, accounting for 0.62% of the national total.
.png)
Cumulative Installations by State by End of 2023
Thanks to falling prices and higher consumer demand, the average size of PV systems in Australia has been increasing year by year. In 2023, the average size of PV systems in Australia was 9.13 kW, setting a new record.

Historical Average PV System Size by State and Nationally
The Northern Territory (NT) has the largest average size at 11.45 kW, while Western Australia (WA) has the smallest at 7.54 kW.
Overall, battery installations for solar systems increased by 8.44% in 2023 compared to 2022. The occurrence of negative electricity prices in 2023 incentivized battery installations. Among the top three states for rooftop PV, two (New South Wales and Victoria) are also leaders in battery installations.
New South Wales ranks first with 5,334 new PV systems with storage batteries. Victoria closely follows with 5,307, and South Australia is third with 4,529.
In terms of cumulative total, New South Wales also leads with 20,184 PV systems with storage batteries, accounting for 22.39% of the national total. South Australia follows with 19,883 (22.05%), and Victoria is third with 19,539 (21.67%).

Cumulative Battery Installations by State
New South Wales also had the fastest growth in installations in 2023, with a 36.31% increase compared to the previous year. Installations in Victoria and South Australia slightly declined.
The Northern Territory has the highest proportion of new PV systems with storage batteries, with 42.23% in 2023. South Australia follows with 17.60%, while other states and territories range from 5-9%.
South Australia has the highest returns on storage batteries due to high price volatility and frequent, severe high-price events in 2023.
Overall, the installation rate of storage batteries in Australia is not high, primarily due to economic factors. The cost of PV installation in Australia is low, less than one-third of the U.S. price, resulting in a short payback period. Adding storage batteries extends this payback period. However, this also indicates significant potential for development. As storage battery costs decrease, coupled with government subsidy incentives, the substantial existing market is worth noting!
Australia has the best sunlight resources in the world. The cost of PV installation is low, averaging only $0.7 per watt, less than one-third of the U.S. cost ($2.77 per watt). PV systems are highly economical. Here is the payback period for PV investments in major cities across Australia with a discount rate of 4.99%:
Most cities have a payback period of 5-7 years. Adelaide has the shortest payback period of 3 years due to excellent sunlight conditions and high electricity costs. Brisbane also has a favorable payback period of 4 years, highlighting why PV systems are so popular in Australia.
4.99% = average interest rate for a 10-year home loan