


February 09, 2026
Your Solar System’s Secret Weapon: The Smart Monitoring App
Share my #SolaXStory


You’ve installed solar panels, and that’s a huge first step. But the panels are just the engine; the Smart Solar Monitoring App is the dashboard, the steering wheel, and the GPS all in one. It’s the tool that transforms your solar system from a passive power generator into an active, money-saving machine for your home.
Without it, you’re flying blind. You know you’re generating power, but you don’t know where it’s going, how much you’re saving, or if you’re leaving hundreds of dollars on the table each year. A modern solar app is no longer just a novelty—it’s the command centre for your entire home’s energy ecosystem.
This guide will show you how to read your app like a pro, turning confusing charts into clear actions that maximise your return on investment. You’ll learn to spot problems, unlock hidden savings, and take full control of your power.
“Think of your app as the difference between owning a power station and running one.”

From Raw Data to Real Savings: Understanding Your Energy Flow
A great solar panel monitoring app does more than just show you a graph of the sun. It answers the three most important questions every solar owner has: “Is my system working?”, “Where is my power going?”, and “How much am I actually saving?”.
Is My System Working? Tracking Solar Generation
This is the most fundamental metric. Your app displays your solar generation in real-time and over days, weeks, and years. You’ll see a classic bell curve on a sunny day—rising in the morning, peaking at noon, and falling in the afternoon. This view is your first-line diagnostic tool, instantly confirming your system is alive and kicking.
Where is My Power Going? Consumption vs. Grid
This is where the magic happens. To truly manage your energy, your app needs to track not just what you make, but what you use. This is done with a consumption meter installed in your switchboard, which unlocks the full picture:
Household Consumption: See exactly when your home uses the most energy. This data, overlaid with your solar generation, reveals your golden opportunity: the middle of the day.
Grid Import: This is the expensive electricity you buy from the retailer, typically in the morning and evening when your solar isn’t producing. The goal is to get this number as close to zero as possible.
Grid Export: This is your surplus solar energy that gets sold back to the grid for a Feed-in Tariff (FiT). While it provides a credit, the real financial win comes from using this power yourself.
By seeing these three forces at play, you can start making smart decisions, like shifting your dishwasher or washing machine cycle from the evening to midday. This simple act of “load shifting” directly replaces expensive imported power with your own free solar power.
“Maximising ‘self-consumption’ is the number one rule of solar savings. Your app shows you exactly how to do it.”
How Much Am I Saving? Translating Kilowatts to Dollars
A key feature of a Smart Solar Monitoring App is its ability to turn energy data into tangible financial results. By inputting your electricity tariff and feed-in rates, the app calculates your savings by adding two key figures:
The value of self-consumed energy: The money you didn’t spend because you used your own solar power.
The value of exported energy: The credits you earned from selling surplus power back to the grid.
This makes your return on investment crystal clear, showing you exactly how your system is performing financially day by day.
Key Takeaway: A smart app visualises the flow of energy in, out, and through your home, allowing you to make simple changes that directly reduce your reliance on the grid and increase your savings.
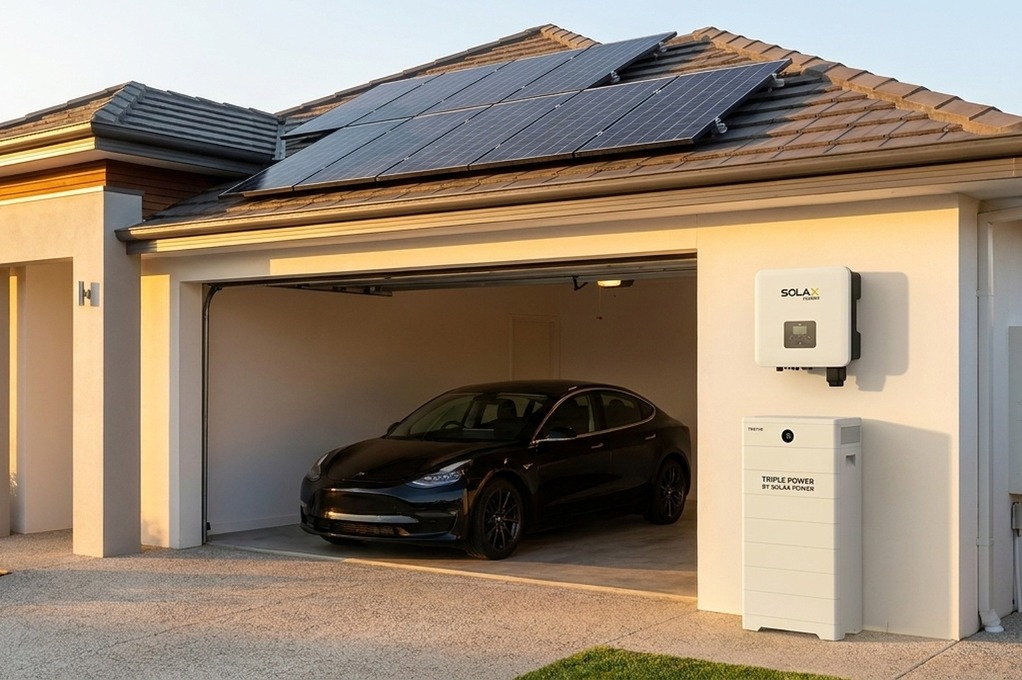
Level Up Your Savings: Active Home Energy Management
Modern solar monitoring is evolving from a passive dashboard into an active control hub. By integrating with other smart devices, your app can automate your savings and make the most of every last photon captured by your panels.
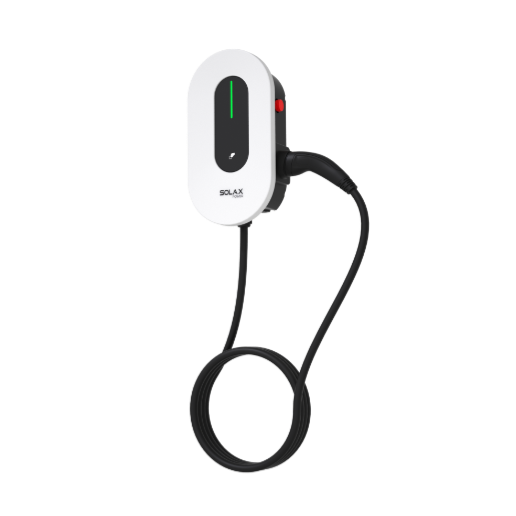
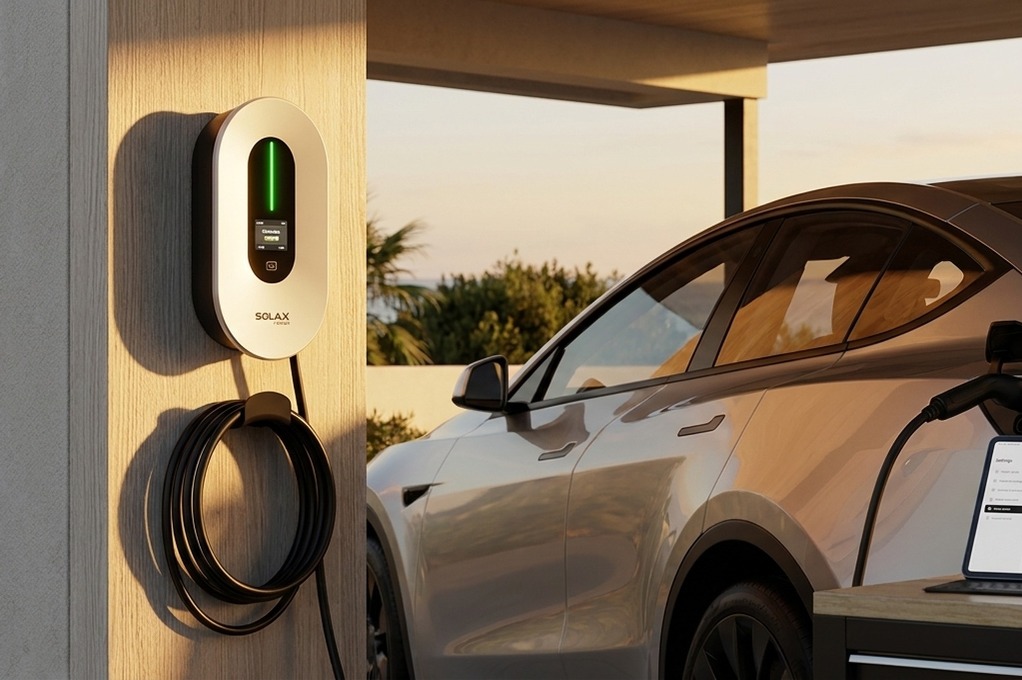
The EV Charging “Killer App”
An electric vehicle is often the biggest power consumer in a home. Smartly integrating its charging is a game-changer. An advanced home energy monitoring system can enable “solar divert” mode for your EV charger.
This means your app tells the charger to automatically adjust its speed to match your excess solar generation. It ramps up in full sun and slows down when clouds pass over, ensuring your car is filled with free, clean energy from your roof—not expensive power from the grid.
Using Hot Water as a “Solar Sponge”
Heating water is incredibly energy-intensive. Instead of exporting your excess solar for a low feed-in tariff, you can use it to heat your water for free.
A smart app can control a hot water diverter, which acts like a “solar sponge.” It detects when you have surplus power and automatically sends it to your hot water system’s heating element. The app then visualises this as self-consumption, providing immediate feedback on the savings you’re making compared to heating water overnight with grid power.
Key Takeaway: By connecting your app to high-load appliances like EV chargers and hot water systems, you can automate your self-consumption and dramatically accelerate your solar savings.
Why Your App Does Weird Things (A Guide to Australian Grid Rules)
Sometimes, your app will show data that looks like a system fault but is actually your inverter following local grid rules. Understanding these Australian-specific regulations can save you a lot of unnecessary stress and service calls.
South Australia: The “Clipping” Effect of Flexible Exports
If you’re in SA, you might see your solar export power suddenly flat-line at a level below its maximum capacity, even on a perfectly sunny day. This isn’t a fault. It’s “Flexible Exports,” where SA Power Networks remotely adjusts your export limit (from 1.5kW to 10kW) to manage grid stability.
⚠️ Warning: This system requires a stable internet connection. If your inverter goes offline, your export limit defaults to a very low 1.5kW, directly cutting into your feed-in credits.
Queensland: The Sudden “Zero” of the Emergency Backstop
In QLD, a grid emergency can trigger the “Emergency Backstop Mechanism.” Energy Queensland can remotely switch off solar inverters across an area to prevent blackouts. In your app, this will look like your solar production has suddenly crashed to zero. It’s alarming, but it’s a sign of the grid protecting itself, not a broken inverter.
Western Australia: The Time-Based Strategy of DEBS
WA’s Distributed Energy Buyback Scheme (DEBS) pays different rates for exports depending on the time of day. You get a low rate in the middle of the day (e.g., 2-3c/kWh) and a higher rate in the late afternoon (e.g., 10c/kWh). Your app is essential for timing your energy use—run pool pumps at midday to use the low-value power, and save your export capacity for the more valuable afternoon window.
Key Takeaway: Australian grid regulations can create confusing data patterns. Knowing your state’s rules helps you distinguish between normal grid interaction and a genuine system fault.
Choosing Your Command Centre: Not All Solar Apps Are Equal
The app is just as important as your panels and inverter. The best experience comes from a seamlessly integrated system where the hardware and software are designed to work together perfectly.
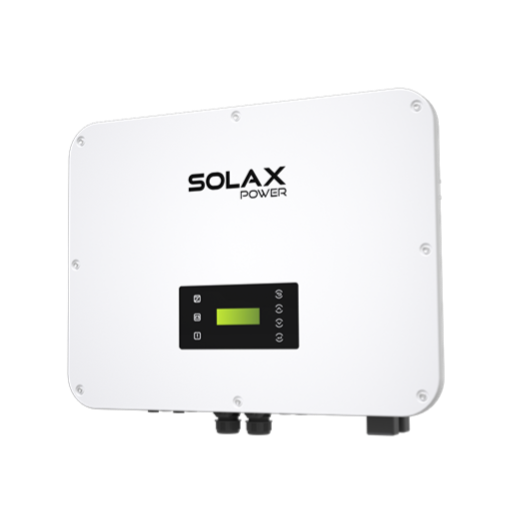
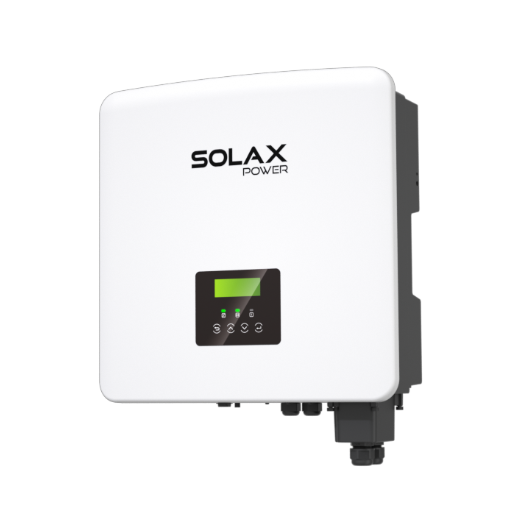
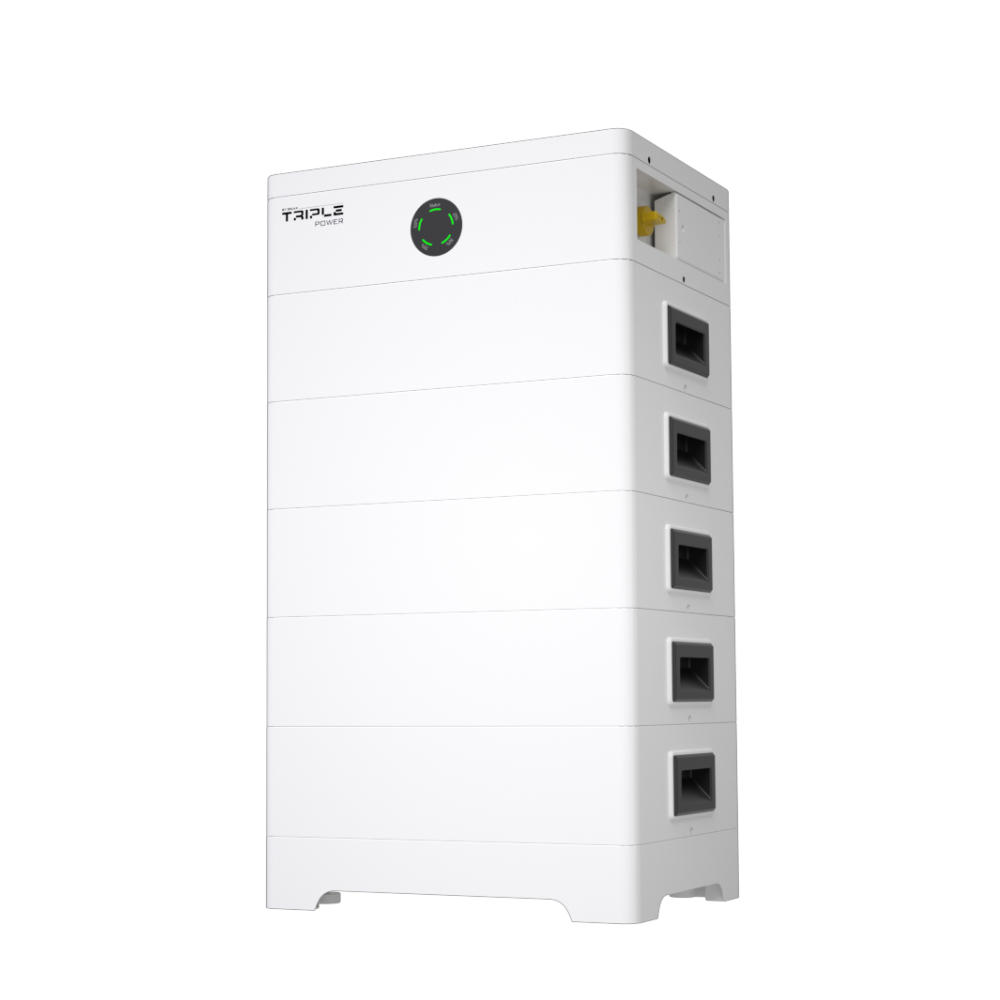
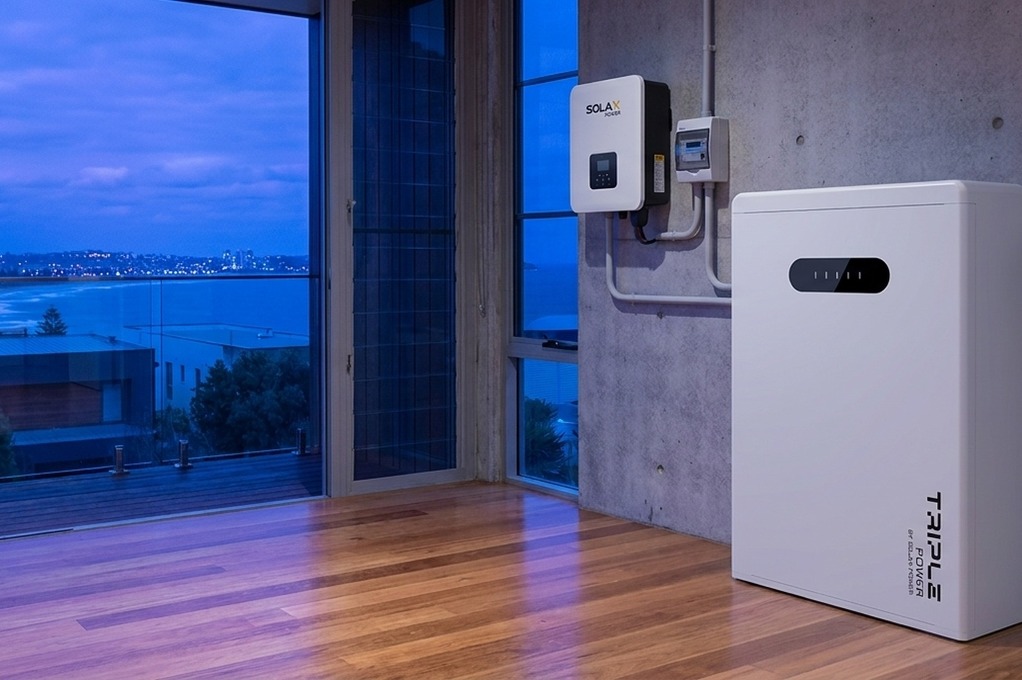
The SolaX Advantage: Clarity, Control, and No Hidden Costs
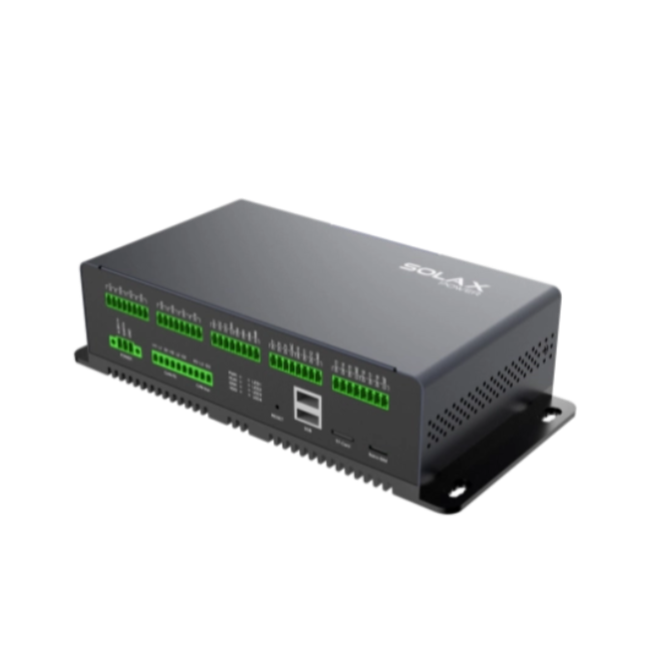
A fragmented system with third-party apps can create headaches. To deliver a seamless user experience, the SolaX Monitoring App is recommended because it is designed as a single, unified ecosystem compared to patchwork third-party solutions.
This ensures flawless communication between your SolaX Hybrid Inverters, batteries, and EV chargers, demonstrating product superiority. Unlike platforms that put your historical data behind a paywall, all your data is free, forever. The intuitive interface provides real-time solar monitoring that is clear, actionable, and designed to help you save the most money with the least amount of fuss.
Key Takeaway: An integrated, manufacturer-provided app like SolaX offers a more reliable, user-friendly, and cost-effective solution than complex third-party platforms with hidden fees.
Quick Fixes for the Most Common App Glitches
Seeing strange data? Before you call your installer, check for these common, easy-to-fix issues.
Glitch 1: Consumption is a Perfect Mirror of Production
If your “Household Consumption” graph is an exact copy of your “Solar Production” graph, it’s almost certainly an installation error. The consumption CT clamp was likely placed on the wrong cable in your switchboard.
The Fix: This isn’t an app issue. You’ll need to contact your original installer to have them physically move the clamp to the correct position.
Glitch 2: Frequent Data Dropouts
Most inverters connect via 2.4GHz Wi-Fi for better range. However, modern mesh routers can try to force them onto an incompatible 5GHz band, causing the connection to fail.
The Fix: Create a dedicated 2.4GHz “Guest Network” on your router just for your inverter. This is the most reliable way to ensure a stable connection for your solar power monitoring.
Glitch 3: Production Drops to Zero on Super Sunny Days
This is likely “Voltage Rise.” On sunny days in areas with lots of solar, the grid voltage can get too high. To protect itself and the grid, your inverter must shut down when the voltage exceeds the legal limit (around 258V).
The Fix: Check the AC Voltage graph in your app. If you see it spiking just before the dropouts, the issue is with the grid. Report it to your local network operator (e.g., Ausgrid, Energex), as they are responsible for managing network voltage.
Key Takeaway: Many common app “glitches” are caused by simple installation errors, Wi-Fi conflicts, or normal grid behaviour—all of which have straightforward solutions.
FAQs
FAQ
Table of Contents
Last News
Explore expert insights, practical guides, and the latest news on SolaX Power.


To the Latest Newsletter
Stay Ahead with the Latest SolaX Updates!
Sign up
I have read and agree to Privacy Policy and User Terms