


December 22, 2025
Calculating Your Solar Payback Period - A Simple Formula
Share my #SolaXStory


Most solar payback calculators are using dangerously outdated math. They rely on a simple formula—System Cost ÷ Annual Savings—that might have worked a decade ago but will mislead you today.
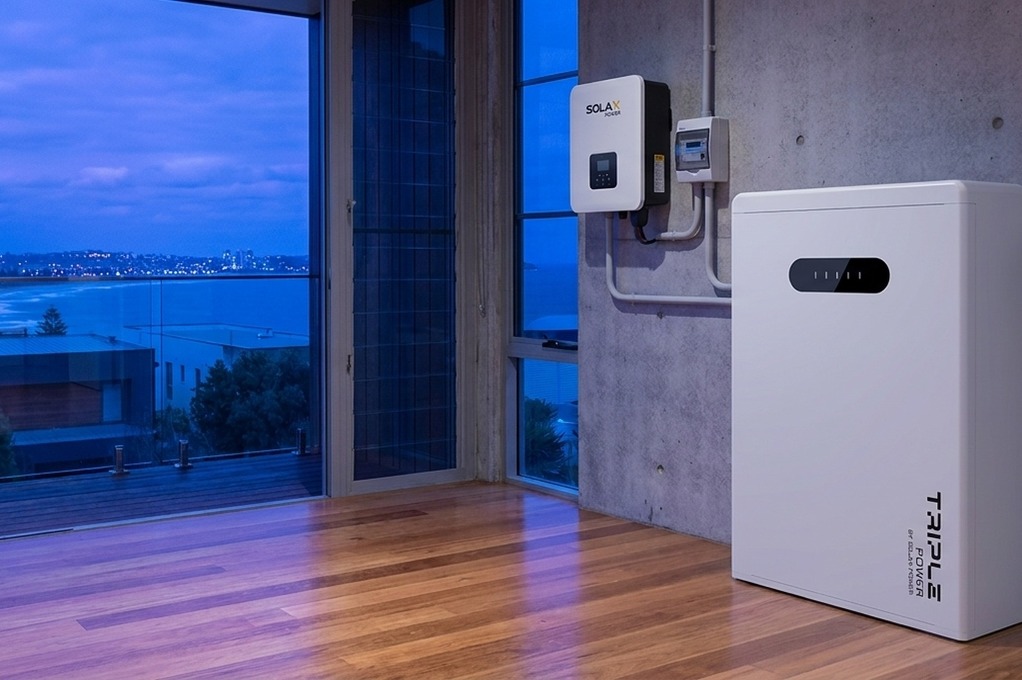
The "Golden Era" of the grid buying all your excess power for a high price is over. We are now in the era of self-consumption, where the greatest value comes from using the energy you generate yourself, which is why a robust, high-output hybrid inverter like the SolaX X3-Ultra 30K, rated at 30000, is essential for managing self-use. Exporting power to the grid now earns you pennies on the dollar.
This guide gives you the framework to calculate a realistic solar payback period in 2026. We'll uncover the hidden costs, grid regulations, and new battery rebates that determine whether your investment will deliver a return in 3 years or 10.
"The simple math you've seen online is a relic. Relying on it can lead to a solar system that never truly pays for itself."

The New Rules of Solar ROI: Self-Consumption is King
The entire economic model for rooftop solar has flipped. The old formula fails because it ignores the massive gap between the value of the electricity you use versus the electricity you sell.
In the past, generous Feed-in Tariffs (FiTs) paid you as much as 60c/kWh for every unit of energy you exported. The grid acted like an unlimited battery. Today, the situation is completely different.
Here’s the reality of the market in 2026:
- Energy used at home (self-consumed): Saves you buying from the grid at ~30-40c/kWh.
- Energy exported to the grid: Earns you a FiT of just ~2-5c/kWh.
- Energy imported at night: Costs you a premium rate of ~40-50c/kWh.
This difference is everything. A huge 10kW system on a home that’s empty all day might now have a worse financial return than a smaller system paired with a battery. Your primary goal is no longer to export as much as possible; it's to use as much as possible.
Calculating Your True Solar Payback Period: The 3 Core Numbers
To get a realistic forecast, you need to move beyond a simple calculator and understand the three core components that determine your real return on investment. The advanced formula for a solar power payback period is:
ROI (years) = (C_net + C_finance) / ((E_self × R_import) + (E_export × R_fit) - (E_taxed × R_sun_tax) - C_opex)
Let's break that down into the three areas that actually matter.
Part 1: Your True Upfront Cost (Beyond the Quote)
The price on a quote is rarely the final price you pay. The upfront cost is the single biggest factor in your solar panel payback period, and it’s often inflated by site-specific expenses.
Average Solar System Costs in Australia (Nov 2025)
| State | 6.6kW System (Budget) | 6.6kW System (Premium) | 10kW System (Avg) |
|---|---|---|---|
| NSW | $4,800 | $6,800 | $9,260 |
| VIC | $3,300* | $5,700* | $8,470* |
| QLD | $4,500 | $6,700 | $8,190 |
| SA | $4,500 | $6,900 | $7,580 |
| WA | $3,000 | $6,600 | $8,470 |
| TAS | $5,400 | $8,000 | $10,870 |
*VIC prices reflect the application of the $1,400 Solar Homes Rebate.
But the sticker price is just the beginning.
A standard quote often excludes necessary electrical work that can add 20-30% to the final cost.
Common “Hidden” Solar Costs in Australia (2025)
Finally, consider the “Replacement Cliff.” A standard string inverter has a life expectancy of 10-12 years and will cost $1,500 – $3,000 to replace. This future expense must be factored into your total cost of ownership.
Part 2: Your Actual Annual Savings
Your savings aren’t static. They are influenced by rising electricity prices and the slow, predictable degradation of your equipment.
Energy Inflation: Your Secret Weapon
Grid electricity prices historically increase by 3-5% per year. A static payback calculator ignores this, massively undervaluing your investment. Solar acts as a hedge against inflation; as grid power gets more expensive, the energy you generate becomes more valuable every single year.
A system with a calculated “static” payback of 5 years often has a real-world “dynamic” payback of just 4.2 years when you account for rising grid costs.
Panel Degradation: The Slow Fade
Solar panels are a depleting asset. They lose about 0.5% of their production capacity each year. While minor, ignoring this can overestimate your lifetime savings by 6-8%. A quality system warranty will guarantee performance won’t fall below a certain threshold (e.g., 85%) after 25 years.
Part 3: The Grid Factors That Can Wreck Your ROI
In 2025, the grid is an active marketplace with rules that directly impact your savings. Ignoring them is a costly mistake.
“Sun Taxes” (Two-Way Pricing)
Implemented in states like NSW, this is a small fee (approx. 1.2c/kWh) for exporting power during the middle of the day. It’s designed to encourage you to use your energy or store it in a battery. While the net financial impact is often minor ($10-$20 per year), it reinforces that self-consumption is the new priority.
Voltage Rise: The Silent Killer
This is the most dangerous hidden threat to your solar ROI. Australian standards require inverters to shut down if grid voltage exceeds 258V. If your street has high baseline voltage, your new solar system can push it over the limit, causing your inverter to trip off right when it should be making you the most money.
⚠️ Warning: Before signing any contract, demand your installer checks your home’s resting voltage. An undiagnosed voltage rise issue can silently kill your savings.
Key Takeaway: A true payback calculation looks beyond the sticker price to include hidden costs, grid risks, and the rising value of self-consumed energy.
The Game-Changer: How a Battery Transforms Your Payback Period
For years, the battery payback period in Australia was over a decade, making them a luxury item. That has officially changed.
The federal Cheaper Home Batteries Program, which started in July 2025, has fundamentally altered the financial equation. By making batteries eligible for Small-scale Technology Certificates (STCs), it provides a significant point-of-sale discount.
The Rebate: Provides approx. $370 – $380 per kWh of usable battery capacity.
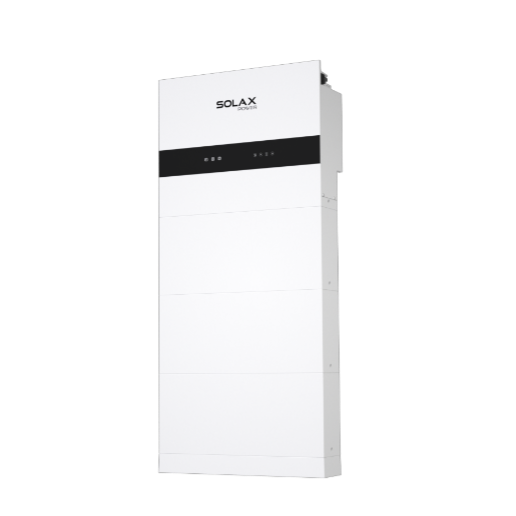
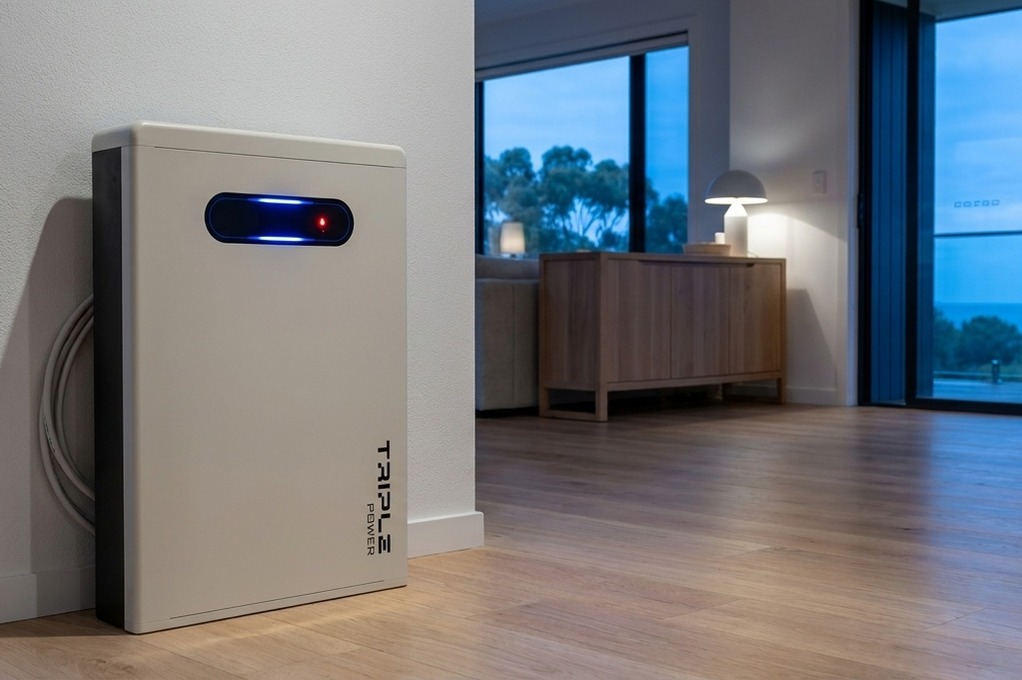
The Impact: For a battery like the Solax T-BAT H 5.8 with 5.8 kWh of usable capacity, this equates to an upfront discount of around $2,157.
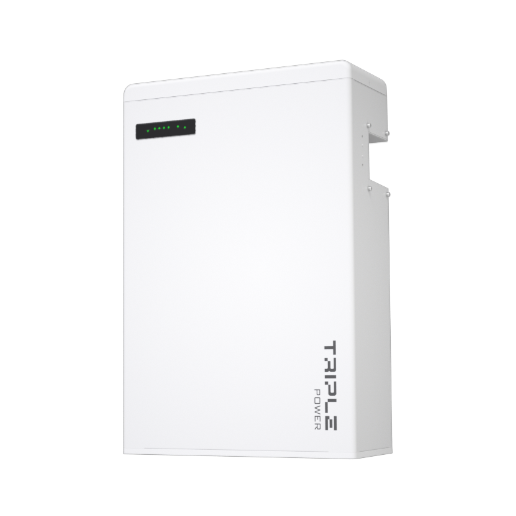
This single policy has compressed the payback period to under 8 years for many households, turning energy storage into a financially rational investment, especially when maximised with a high-capacity solution like the Triple Power T-HS66.5, which provides 66.5 kWh of usable storage.
A Real-World Battery ROI Example (Sydney, 2025)
Let’s calculate the payback for adding a Solax battery to a home in Sydney.
Installed Cost (Solax T-BAT H 5.8): ~$8,500
Less Federal Rebate: -$2,157
Your Net Cost: $6,343
Calculate Annual Savings: Store 5kWh of solar per day to avoid buying expensive evening power.
Daily Savings: 5kWh x (50c/kWh peak import rate – 5c/kWh forgone FiT) = $2.25 per day
Annual Savings: $2.25 x 365 = $821 per year
Calculate Payback Period:
$6,343 (Net Cost) ÷ $821 (Annual Savings) = 7.7 Years
A 7.7-year payback means the battery pays for itself well within its 10-year warranty, making it a sound financial decision.
Key Takeaway: The 2025 Federal Battery Rebate has slashed battery payback periods to under 8 years, making them a financially smart addition for households looking to maximise self-consumption.
Your Solar Payback: A State-by-State Breakdown
Australia is not one single energy market. Your payback period depends heavily on local electricity prices, rebates, and grid rules. Here’s a quick overview:
Key Takeaway: Your location dramatically impacts your solar ROI. What works in Perth won’t necessarily work in Melbourne, so local advice is critical.
FAQ
Table of Contents
Last News
Explore expert insights, practical guides, and the latest news on SolaX Power.


To the Latest Newsletter
Stay Ahead with the Latest SolaX Updates!
Sign up
I have read and agree to Privacy Policy and User Terms